A Live Training-Plan Report, Built by Conversation
When I finished a 32-week training programme, I asked Claude to write a debrief of it from my CTI data. It read like a story: what changed, why it changed and what to do next, with every claim backed by a chart or a ride. Data dashboards don't do that. I wanted the same story for my weekly training, so over two days I described a live report to Claude, one sentence at a time, and it built a page that reads the data through CTI's MCP server. The report is useful. Building it was more useful, because it showed what the native version should be and where the data model was weak.
A debrief that told a story
CTI (Cycling Training Intelligence) runs as Routebook at routebook.app. It stores every ride, works out training load (TSS), fitness, fatigue and form, splits rides into power and heart-rate zones, and keeps a training plan under Settings › Plan.
I don't write that plan myself. Routebook has an AI chat, and I use it to design the plan from one simple goal: to ride at 4 W/kg, comfortably, on undulating Spring Classics terrain.
In April I started a training programme of two blocks. It ended on 15 November with a goal test I missed by 34 W. I asked Claude to read all 32 weeks from CTI (259 rides, my ride notes, zones and fitness) and explain what happened. The result was the Spring Classics Debrief.
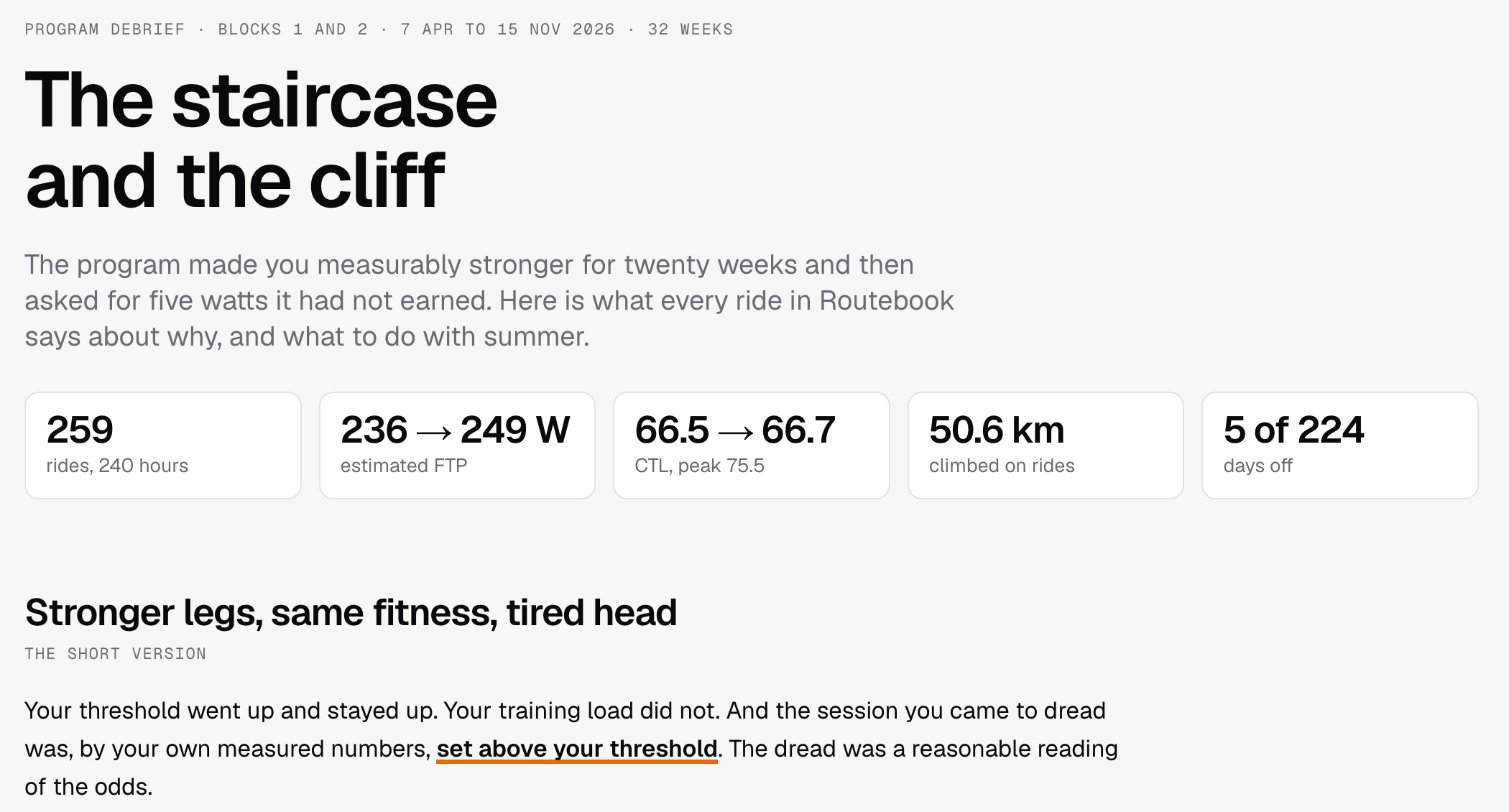
It used the same numbers a dashboard would. What made it different was how they were arranged:
- A headline that states the finding. "The staircase and the cliff": the programme made me stronger for twenty weeks, then asked for five watts it had not earned.
- Section headings that make a claim. "Every step was earned, except the last" and "The canary was the 2x20" tell you what the chart below proves before you look at it.
- A paragraph before each chart. Each one says what to look for and why it matters, so the chart is evidence for a point, not something to work out for yourself.
- My own words quoted back. On 3 November I wrote that I would not have thought 5 W more could be so much harder. The debrief set that note beside the numbers that explained it: 250 W was my threshold and 255 W was past it.
- Cause and effect, with evidence. What produced the gains, what broke the second block, and a ride or a figure for each.
- My theory checked. I thought the problem was mental fatigue. The debrief tested that against the record and answered "partly, and it was the symptom more than the cause".
- Recommendations at the end. They became my next plan.
A dashboard shows the numbers and leaves the reader to decide which ones matter, how they relate and what to do. A story makes those decisions and shows its working. The debrief changed what I did next. No dashboard had.
The problem
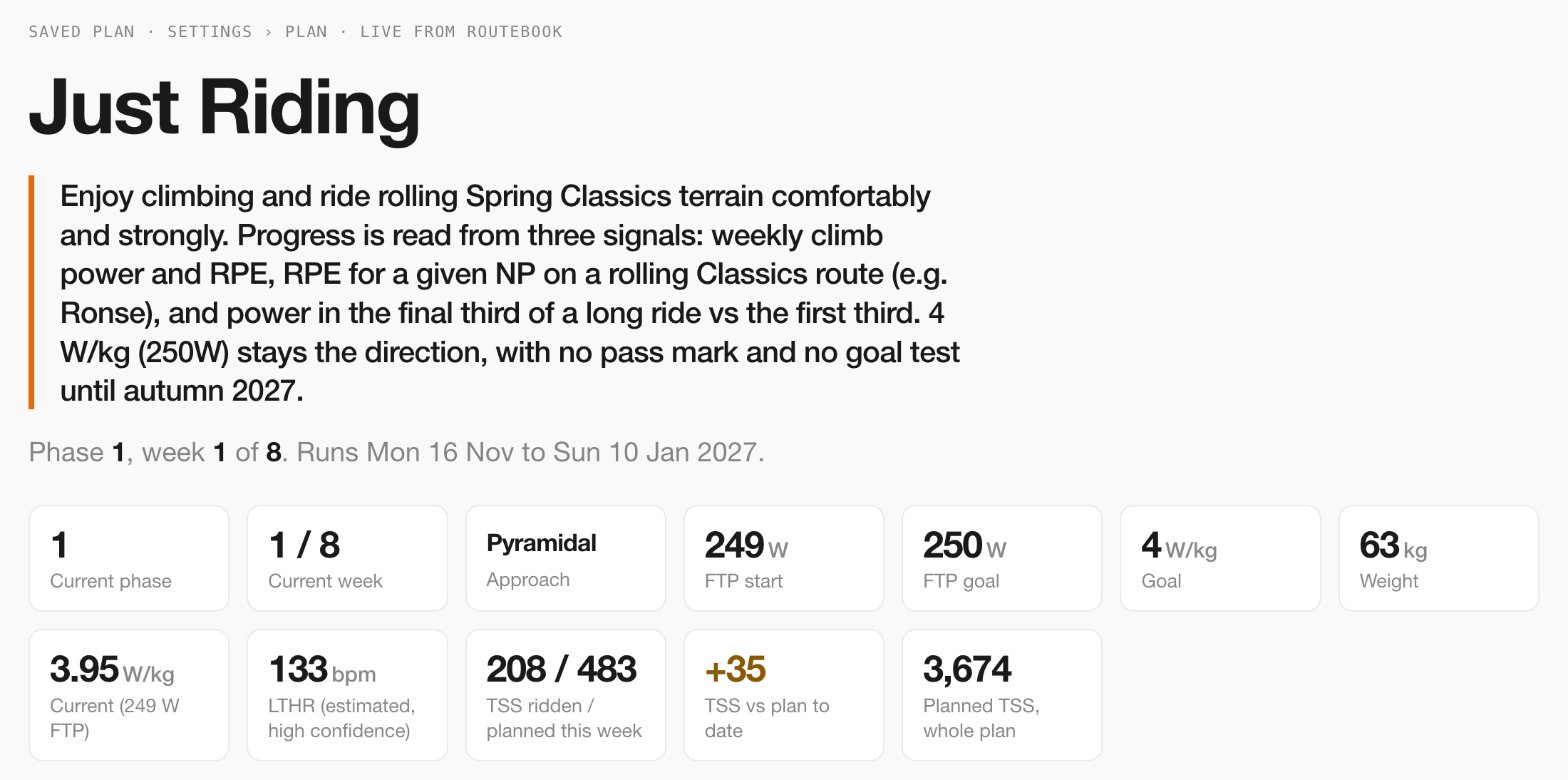
The debrief's recommendations became the plan I am riding now: an eight-week block called "Just Riding", with two cycles of three normal weeks and one easy week, plus rules, guidance, a workout rotation and a ledger of benchmark rides.
The debrief was a review of a programme that had ended. I wanted the same kind of story every week, told while the plan was running and built from live data. CTI had the data, but in two places that never meet:
- Settings › Plan shows the plan's words (rules, guidance, phases, the ledger) with no numbers beside them.
- The weekly and block panels show the numbers (load, zones, form, rule compliance) with none of the plan's words.
A weekly check-in raised questions like these. Does "Wednesday stays a true recovery spin (TSS under 30)" hold? Is "460–510 TSS in normal weeks" happening? Is Saturday's climb power rising at the same effort? Each answer was on a different screen.
Why not build it in the app first
The app is the right long-term home. A native view would work for every user, need one request instead of dozens, be typed and tested, and cost nothing in AI calls. It was not the right first step, for four reasons:
- I did not know what the report should be. A report is a design problem first. Building it natively means choosing components, endpoints and layout before knowing which panels are worth keeping. In the artifact, a design change cost one sentence.
- The panels and the report do different jobs. The panels answer "what now?" at a glance, in a drawer beside the map. A plan review answers "how is the plan going, and why?" It reads top to bottom and mixes data with the plan's own words. That page did not exist in the app, and I wanted to use it before building it.
- The data contract already existed. CTI has an MCP server that Claude can call. The report could read the same numbers the app uses without any new backend code.
- It would show what to fix. Building against real data found 14 gaps in the plan schema and the MCP tools, most of them free text that should be structured. Most are worth fixing whether or not the report is ever built natively.
So the artifact became the prototype, and the native page became the follow-up.
How it is put together
A Claude Data artifact is a page hosted on claude.ai that reads live data through the viewer's own connectors. This one reads from CTI, and only from CTI.

The MCP server. It runs inside the CTI Next.js app at /api/mcp. Claude connects to it as a custom connector using OAuth 2.1. A tool is registered for a request only if the token carries its scope, so the tool list shows exactly what that caller may do, and the default Claude grant is read-only. Every call is audited. The report uses five tools:
| Tool | What it returns | What the report uses it for |
|---|---|---|
read_profile |
The saved plan, profile, power and heart-rate zones, and the current week and phase | Header, phases, day cards, rules, guidance, workouts, benchmark ledger, pull quotes |
get_block_summary |
Planned against ridden per week, rule compliance, target meters, focus items, strengths and limiters | Weekly load chart, compliance grid, target meters, summary paragraph |
get_fitness_state |
Fitness (CTL), fatigue (ATL), form (TSB) and daily TSS | The 28-day recovery chart |
get_time_in_zones |
Power and heart-rate time in each zone | Time in zones, and the zone strip under each week |
get_weekly_summary |
One week's rides with distance, climbing, time, TSS and effort | Volume charts, the "ridden" line on each day card, the 30 km rule |
The artifact. It has three layers:
- Datasets. Each is one connector tool call plus a short function that turns the JSON answer into rows.
- Calcs. Small derived datasets computed in the browser: weekly totals, block TSS, current W/kg, daily and weekly volume.
- Drawings. Each marked element on the page has one draw function. Charts use d3; everything else is plain DOM.
The page opens, runs its datasets through the connector and draws. When I ride and CTI syncs, reopening the page shows the new ride. There is nothing to regenerate or export.
Three properties mattered more than I expected:
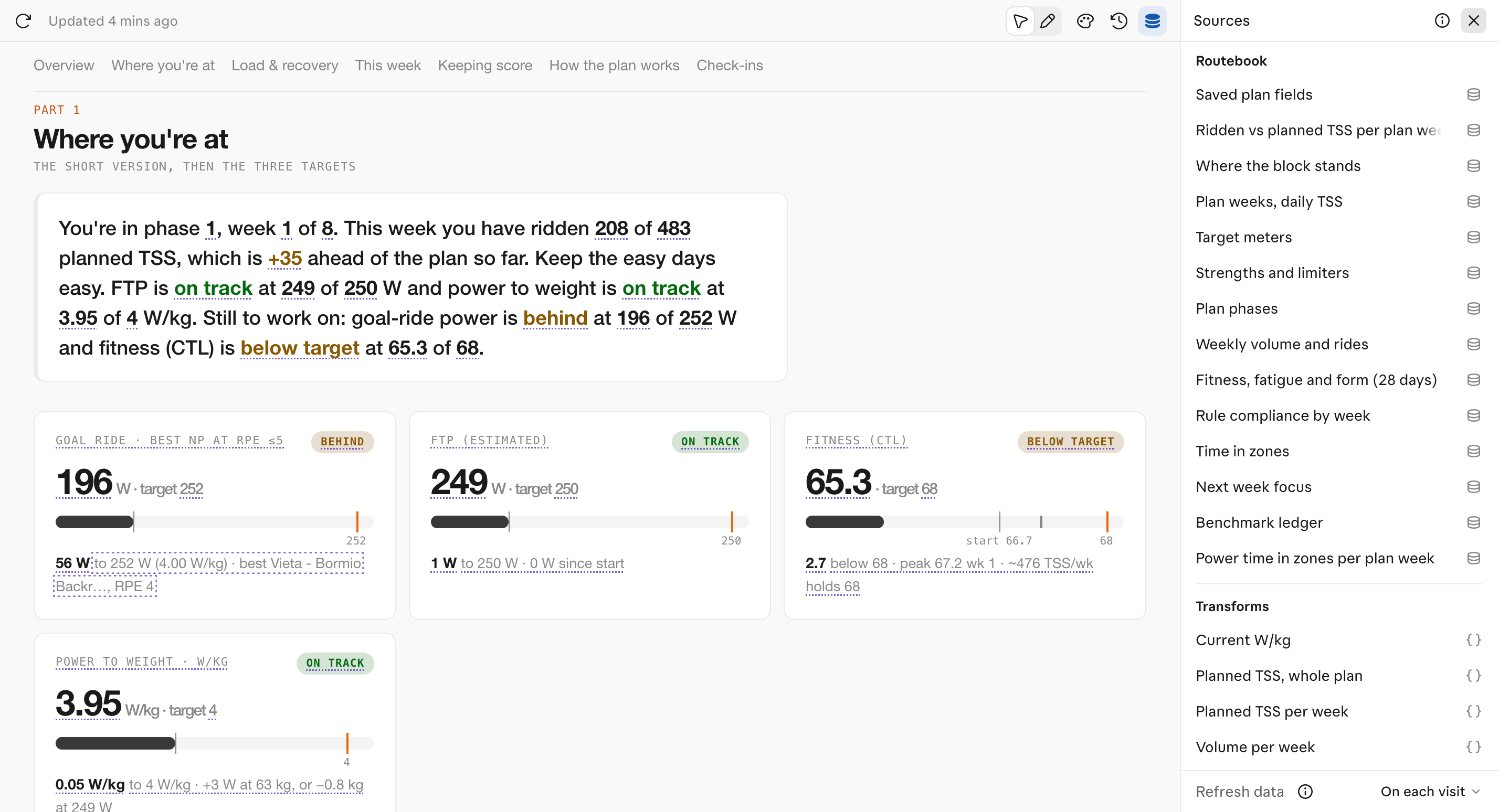
- Every number can be traced. The Sources panel lists each dataset, its tool call and the function that shaped it. With the panel open, each traced value on the page is underlined.
- Each viewer sees their own data. The page carries no data. Someone I share it with sees their own CTI data through their own connector, or nothing.
- Every change is checked. The page reports whether every drawing rendered, so each edit was confirmed before the next one.
Built in one conversation
I did not write the HTML. I described what I wanted in plain sentences, and Claude wrote and published each change, read the result back and confirmed the page passed its check. There were about 40 versions over two days, almost all of them one-sentence requests:
- "add planned vs ridden TSS to the weekly chart"
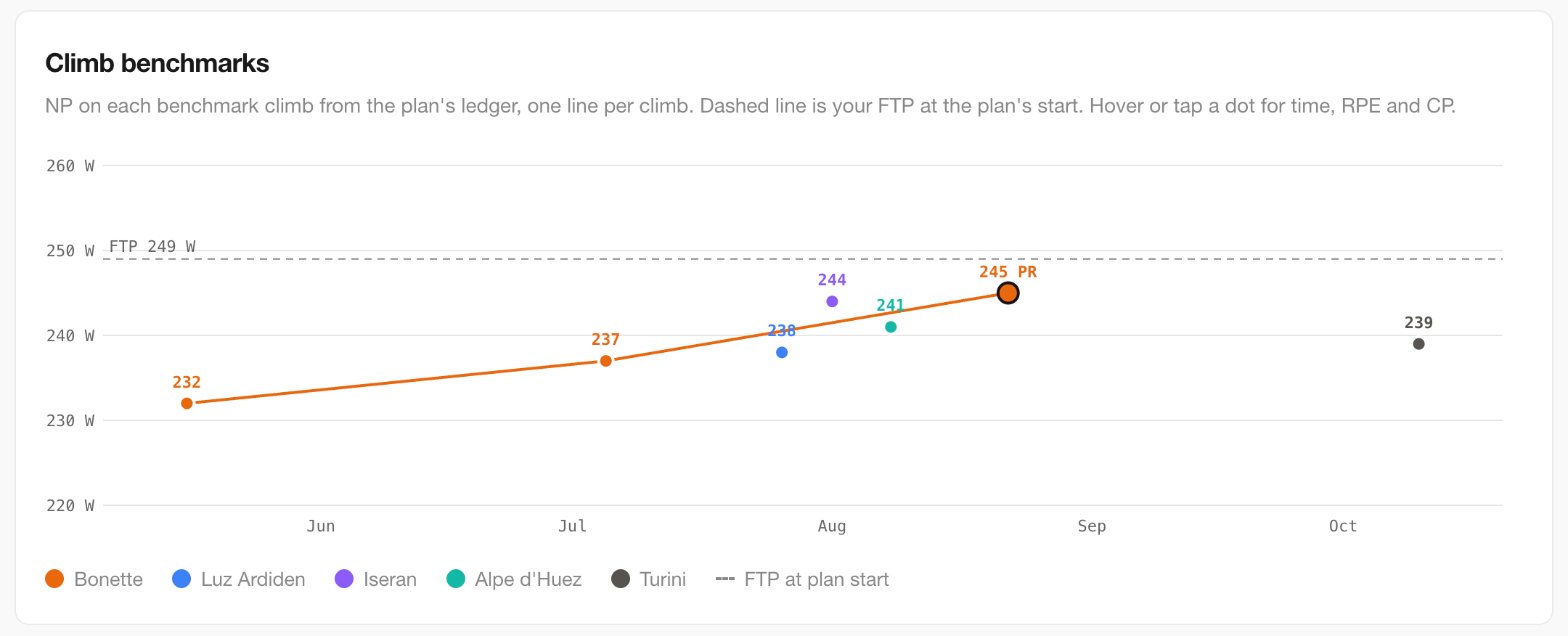
- "add the climb benchmarks chart to Keeping score"
- "the line spacing for wrapped secondary text should be a bit tighter"
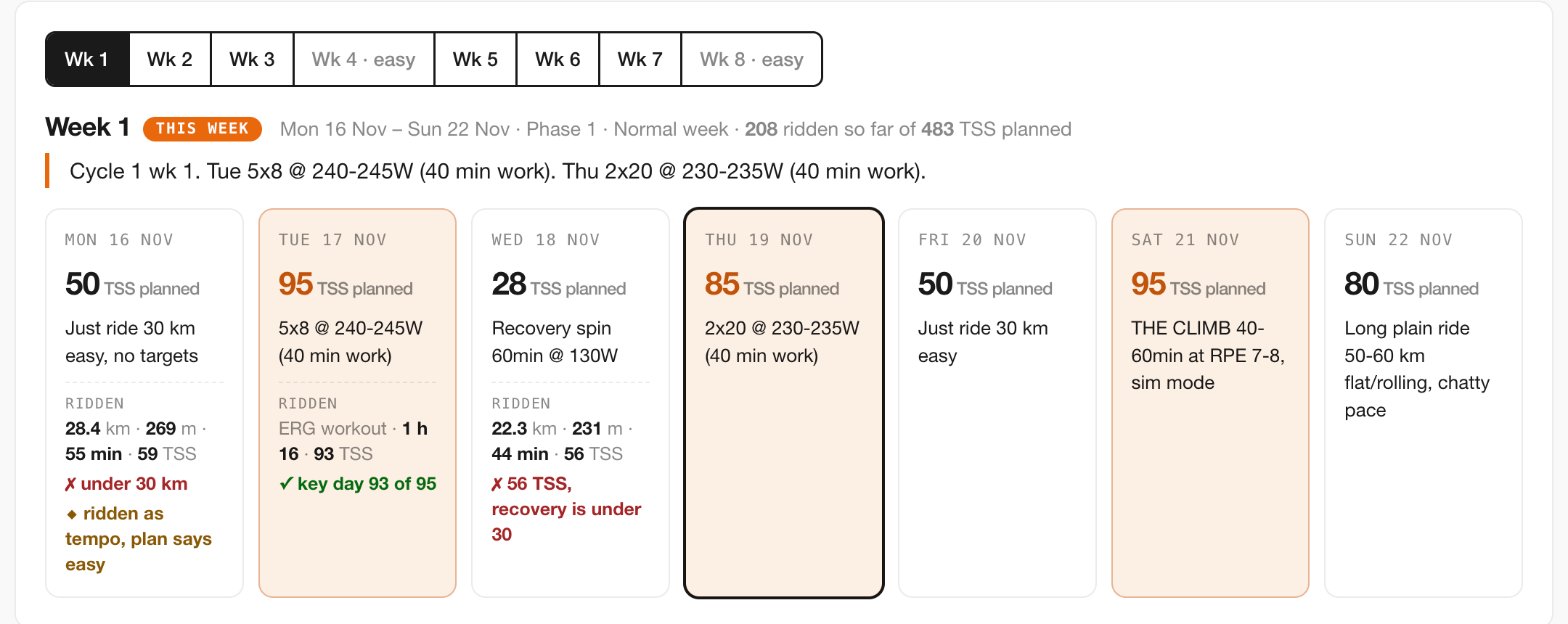
- "for today the plan called for TSS 28 and I did 56, yet this is not flagged"
The visual style came from the debrief: Geist type, white cards, one orange accent. Claude reused it so the two read as a set.
The most valuable requests were the ones that were not about layout:
- "Add expected time-in-zones shapes for the approach. Only if it is correctly derived from the approach, otherwise just say no." Claude said no. CTI judges a pyramidal or polarised approach by sessions, how many rides were easy, moderate or hard, not by the share of time in each zone. A time-share overlay would have looked authoritative and been wrong. The panel got a sentence about sessions instead.
- Distance and climbing. My first rule was that climbing counts for indoor and outdoor rides but not for ERG workouts, where the trainer sets the power and the route only sets a virtual speed. I then changed it: distance and climbing both exclude ERG workouts, so time is the only volume measure that includes everything. Claude checked the rule against the data before building it.
- Compliance flags. A recovery spin planned at 28 TSS and ridden at 56 went unremarked on its day card. Rather than invent a tolerance, the flags reuse the plan's own thresholds from the block summary: recovery days under 30 TSS, key days at 85% or more of plan, and "ridden as tempo" when an easy day came back harder.
The rule I kept relearning: when the app already defines something, the report uses that definition, not a plausible one of its own.
Summary, evidence, action
The first version was a pile of panels: a dashboard again. The second was organised as a story, like the debrief, and that is what made it worth reading rather than something to audit. It runs summary, evidence, action: where you stand, then why, then what to do next, followed by the scoreboard and the reference material.
| Part | Job | What is in it |
|---|---|---|
| Header | Who and where | Plan name and goal, then phase, week, approach, FTP, W/kg, weight, LTHR and TSS this week and to date |
| 1. Where you're at | Summary | A plain-language paragraph built from the live data, target meters, strengths and limiters |
| 2. Load and recovery | Evidence | Planned against ridden per week, volume, fitness, fatigue and form, time in zones |
| 3. This week, and the next | Action | Day cards with the planned session, what was ridden and rule flags, then next week's focus |
| 4. Keeping score | Scoreboard | Rule compliance by week, climb and route benchmarks, the ledger |
| 5. How the plan works | Reference | Phases, rules, guidance, workout rotation |
| 6. Check-ins | Close | What to ask Claude, and when |
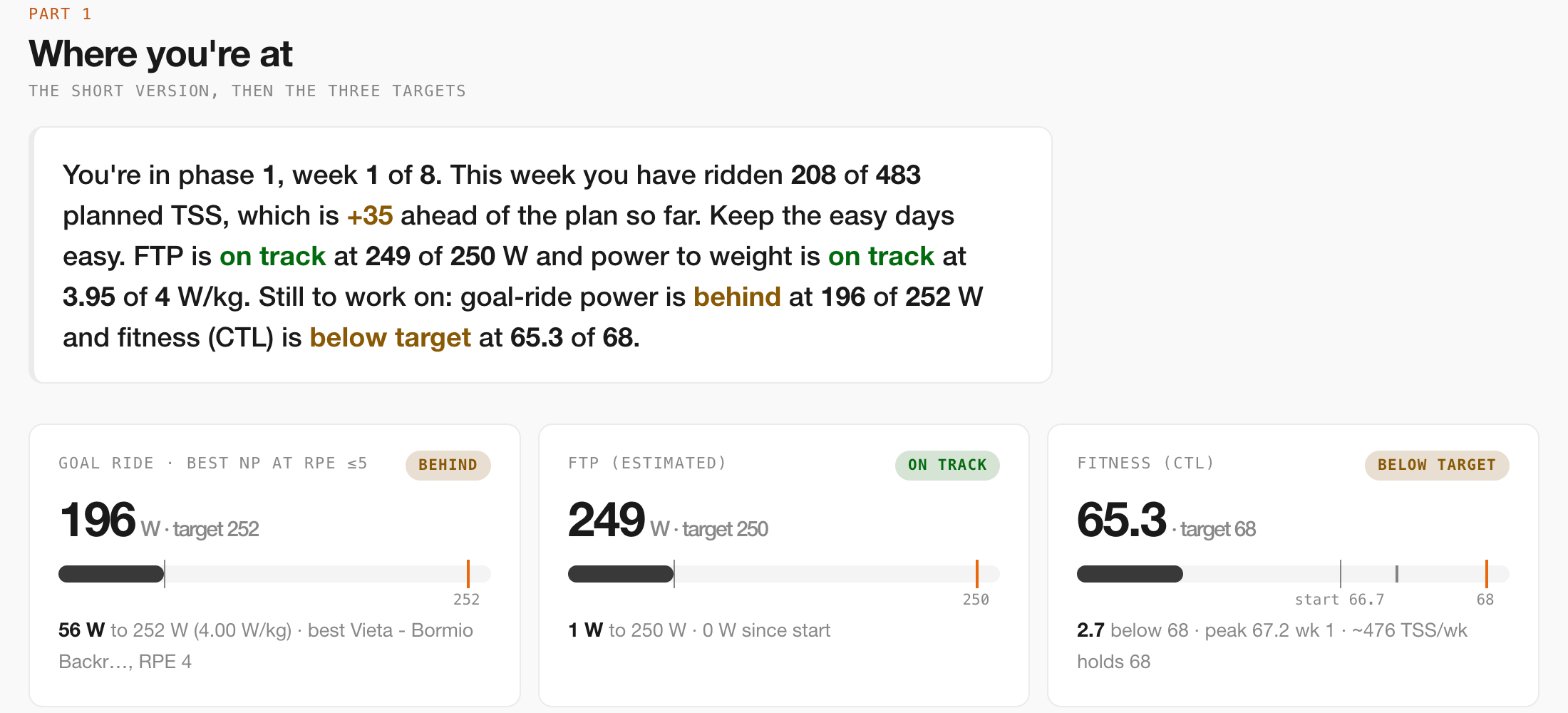
A few details made the story work:
- Pull quotes from the plan between parts. Each one is the plan's own sentence about what comes next. "Do not chase weekly TSS" closes the load section. They are read live from the plan, so they change when the plan does.
- The summary paragraph is live and deterministic. It is built from block data with no AI at view time, and it puts phase before week ("phase 1, week 1 of 8") to match the header.
- The chart leads to the detail. Tapping a week in the load chart selects that week's day cards in Part 3, so the evidence sits above the action it explains.
- Absence is stated. A past day with no ride says "Not ridden". Today and future days stay blank until ridden, so today never looks like a failure at 9 a.m.
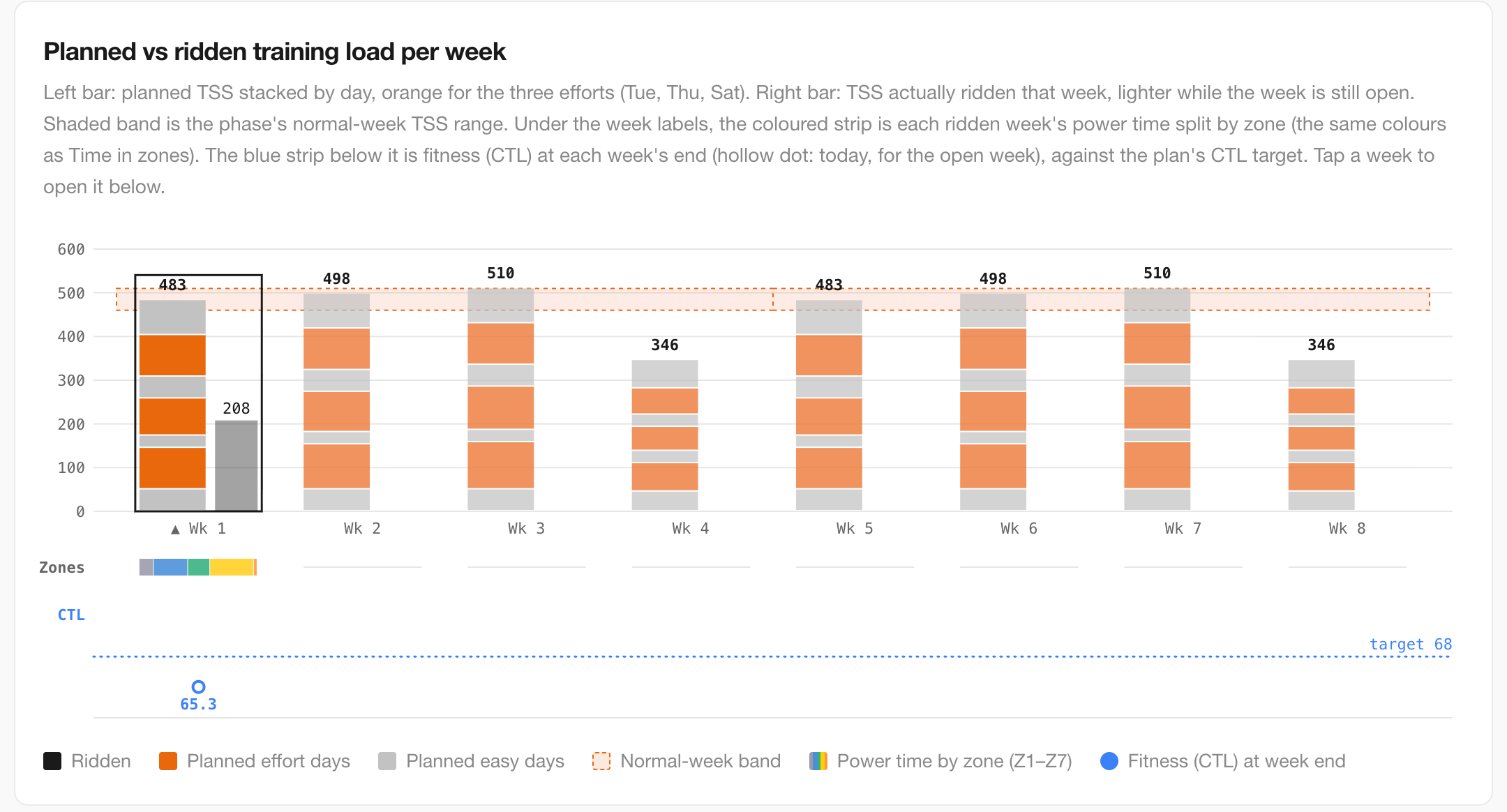
Near the end I asked whether Parts 2 and 3 should swap, since "this week" is what I want first on a daily open. Claude recommended keeping the order. Swapping would put the action before its evidence, break the link from the chart to the day cards and leave the pull quotes out of place. The daily need is better met with a shortcut to today. A reading order and a daily-glance order are different things, and a report has to choose one.
Changing the plan from the report
The report is read-only, but the page it sits on is not. claude.ai shows a Chat button beside the artifact. On the Thursday of week 1, with the report open, I wrote:
I'll swap Wed and Fri this week so Friday will be ~30TSS. Today I'll ride workout at 230W although I think I'll be comfortable at 235W given I've handled 245W in the past - I'll start at 230W and keep things conservative
Claude read the plan first, then changed it. My connector has one more permission than the report needs: profile:write, which adds the update_profile tool. Each change through it is checked against the plan schema before it is saved. Claude swapped the two days in week 1, so Wednesday became the 50 TSS just-ride day, matching the 56 TSS I had ridden, and Friday became the 28 TSS recovery spin. It confirmed the week still totalled 483 TSS and noted the swap and the 230 W choice in the week's focus.
The reply was coaching as well as an edit, and it drew on the plan and on the debrief:
- The watts carry through the cycle. The plan holds Thursday's power for all of cycle 1 and lengthens the efforts instead: 2x22 next week, then 2x25 in week 3. Starting at 230 W means the 2x25 is at 230 W too. That session decides whether the watts step up 5 W for cycle 2, so making it more likely to come in at RPE 6 or below is the right trade.
- 245 W is the wrong comparison. I rode 2x20 at 245 W at RPE 4 to 5 in August, but by November the same session had drifted to RPE 7. Undoing that drift is what this block is for, so if 230 W feels easy, that is a good sign, not a reason to add watts.
- Today's conditions. Form (TSB) of about −5 is fine for the session. Cadence 90 or above, ride before lunch, and log the RPE afterwards, because Thursday's RPE is the one number the plan tracks each week.
When the report next loaded, it showed the change. Wednesday's 56 TSS was no longer flagged as a failed recovery day, and "TSS vs plan to date" dropped from +35 to +13.
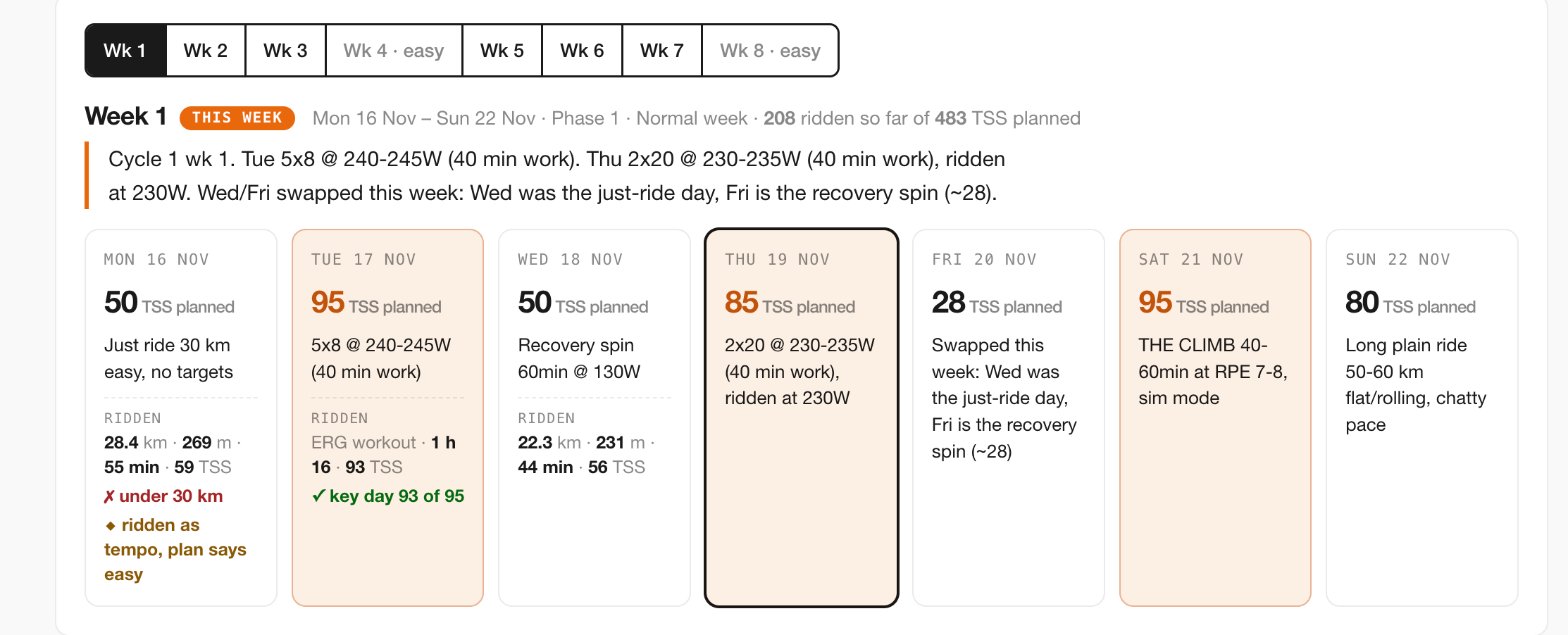
There are no separate notes to keep. The plan is the record of what changed and why, and the report, the app and the next conversation all read it. One detail did not carry over: Wednesday's card still names the recovery spin, because the swap moved the TSS figures and put a note on Friday but left Wednesday's session text as it was. It is another item for the list of things the plan schema should structure.
The report shows where the plan stands. The conversation beside it changes the plan, and both use the same tools.
What it cost, and what it found
Cost. One page open makes 22 MCP calls in week 1, rising to about 36 by week 8, because each dataset is one tool call. The block summary alone is fetched nine times. First load takes several seconds. That is fine for a weekly review, not for a page opened twenty times a day.
Fragility. Some of the plan is free text: the benchmark ledger ("Bonette 16 May NP 232 53:37 RPE 6 | …"), the list of benchmark climbs, the just-ride days and the 30 km rule. The artifact reads these with regular expressions, which break if the wording changes. The ledger has no year, so a ride logged across New Year would be dated wrongly.
Findings. Each workaround in the artifact pointed to a gap in CTI. The main ones:
- Structure the free text. The benchmark ledger, the climb list and the just-ride rule become fields in the plan schema, not sentences.
- Return what the report had to parse. "Ahead of plan to date" exists only inside a sentence in the block summary. It should be a field.
- Make the timezones agree.
get_time_in_zonescounts days in UTC while the other tools use the rider's timezone, so a late-evening ride in New Zealand can land in the wrong week. - Add one aggregate tool. A
get_plan_reporttool would return everything the report needs in one call instead of 22 to 36.
None of these showed up in the app. The report found them because it was the first thing to use every part of the plan at once.
The loop
The report will move into CTI as a native "Plan review" page, built on the same code as the weekly panel and served by one endpoint. The artifact does not go away. It switches to the aggregate tool and stays as the place to try the next design.

When AI operates the software noted that people may use a product without opening it, because their own AI calls it. This report is an example: it is a CTI view that runs entirely outside CTI. That only works if the tools are right, and once they are, the chat, the artifact and the app all read the same numbers.
If you are considering building one
- Expose your data as an MCP server first. Scoped, read-only by default and audited. The report is only as good as the tools, and the same tools then serve chat, artifacts and the app.
- Reuse the app's definitions. Zones, compliance thresholds, how an approach is judged: if the app has a rule, the report uses it. Ask Claude to say no when a request cannot be derived correctly.
- Choose the reading order before the panels. Summary, evidence, action, then scoreboard and reference.
- Put the source text beside the numbers. Rules and quotes next to the data they govern are what make the report worth reading.
- Ask for one change at a time and check each one. Small requests, published and verified each time, work better than a large specification.
- Write down every workaround. Each regular expression or guessed default is a gap in the data model, and that list can be worth more than the report.
- Count the calls. Datasets map one to one onto tool calls. If one view needs dozens, add an aggregate tool.
- Treat the artifact as the prototype. When it proves useful every week, build it natively and point the artifact at the aggregate tool.
CTI's MCP server · When AI operates the software · CTI case study · CTI's reinforcing evals loop